Interactive Timeline of Bird Flu Data
This is a little project I've been working on. It shows the progress of confirmed cases of Avian Flu over time, and is based on data from the World Health Organization. Please note that they only report cases that have been confirmed by laboratory testing.
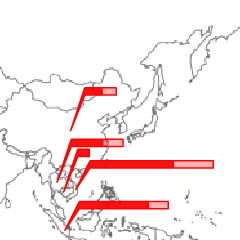
Data Visualization of Avian Flu Cases in Humans
The most challenging part of the project, in all truth, was to convert the data from the format the WHO published it into an XML formatted data structure. It was the manual formatting that took the most time and concentration.
This animation, to use a current catch-phrase, uses client-side logic to render data from an external data source (in XML format), and can be updated without editing the swf file.
Please note that this is a work in progress, and there are a number of features I will be adding in the future, including greater user interaction with the data, alternative rendering views, and the overlay of other data (such as cases in birds).